An introduction to multitrack spectroscopy and its applications

In many applications of optical spectroscopy, it is useful and/or necessary to simultaneously observe several input sources to gain more information from a sample; for example, measuring and correlating spectra at separate locations or improving efficiency and speed through parallel acquisition of signals.
While it is possible to use a separate spectrograph for every signal input, challenges arise when scaling up the number of channels to dozens or hundreds. Multitrack spectroscopy is a technique that only requires a two-dimensional camera on a single spectrograph to measure multiple input signals on separate rows on the sensor. This technique can be applied to any common form of spectroscopy, such as photoluminescence or Raman spectroscopy. Next-generation spectrographs in combination with large-area detectors are designed for true multitrack spectroscopy capabilities using dozens to hundreds of source channels simultaneously.
Multitrack techniques increase efficiency and reduce overall time for spectroscopic measurement tasks, making them optimal for new developments in fundamental research, but also for industrial research and development, quality, and process control applications.
What is multitrack spectroscopy?
In a spectrograph, light from the signal source enters the instrument through an entrance slit and is coupled by free-space or fiber optics. The dispersive element within the spectrometer splits the light up into its color components. It is typically a diffraction grating selected to achieve best spectral resolution and efficiency. An optical imaging system, consisting of collimating and focusing optics, then creates an image of the slit in the focal plane. The slit image will be reproduced at a different location in the focal plane for every discrete color in the input signal (see Fig. 1).
To create and enable readout of the multitrack image in the focal plane, the signal in the focal plane is encoded along a spectral and a spatial axis of information. The spectral axis is oriented along the horizontal direction, where different wavelengths dispersed by the diffraction grating are imaged on different columns of the detector. The spatial axis is oriented in the vertical direction. As the spectrograph optics create an image of the entrance slit within the focal plane, any incoming light that is in a different position along the entrance slit will be mapped onto a different row on the detector. In multitrack spectroscopy, the signal from multiple light sources is coupled into the spectrograph at different positions along the entrance slit. The camera then detects distinct horizontal lines on the detector (visually looking like stripes). The width of each line depends on the size of the input source.
The detector for signal acquisition is positioned at the focal plane of the spectrograph. Most low-light spectroscopy applications, from the UV to the near-infrared, use back-illuminated and deep-depleted CCD cameras. By design, CCD cameras read out all imaging pixels in series through a single readout node, making them well suited for standard spectroscopy measurements, but relatively slow for imaging tasks.
For single-track spectroscopy applications, binning the signal on the CCD is often used to increase readout speed and signal-to-noise ratio. However, this scrambles spatial information, so therefore binning cannot be used for multitrack spectroscopy. In addition, multitrack spectroscopy requires a CCD with a mechanical shutter to block light accumulation on the sensor during readout. Without a shutter, signal on the detector would smear and mix between spectral tracks.
Large-format CCD sensors often feature multiple readout modes to compensate for slower readout times and are a good detector of choice for multitrack experiments; however, electron-multiplying CCDs (EMCCDs) and scientific CMOS (sCMOS) cameras are faster. These sensors do not require a mechanical shutter, so they are optimal for measuring multitrack spectra of dynamic, rapidly changing events. Large sensors are able to support applications using dozens to hundreds of input channels. Indium gallium arsenide (InGaAs) focal-plane arrays are an alternative detector choice and required for detection of wavelengths between 1000 and 1700 nm.
Optical properties of multitrack spectrographs
Multitrack signals cover a large area in the spectral and spatial directions on the camera sensor. Therefore, it is crucial that the spatial image resolution is high and consistent across the whole sensor with minimal optical aberrations. However, image aberrations of traditional spectrographs using the Czerny-Turner design can be quite large. For example, Czerny-Turner systems use a toroidal mirror to correct for astigmatism. While toroids can fully correct astigmatism at the focal-plane center, the aberration reappears at positions left and right of center, resulting in a bowtie-shaped image (see Fig. 2). Input channels need to be spaced further apart to be detected without signal overlap, reducing the overall number of channels that can be detected simultaneously.Reducing the input aperture (for example, by using a longer focal length system or masking spectrograph optics) significantly improves aberrations and increases multitrack capabilities. However, this is only achieved by significantly compromising spectral bandwidth and light-collection efficiency. Next-generation, aberration-corrected spectrograph designs remove this limitation.
How many tracks can be resolved?
The total number of channels that can be detected by the spectrograph depends on the density of the channels on the detector and the size of the detector. High optical imaging power and low aberrations increase the density of optical channels that can be observed simultaneously. Therefore, both spectral resolution (in nanometers) and spatial resolution (resolvable line pairs per millimeter) across the entire focal plane need to be evaluated for a multitrack spectrograph. This gives a measure of the usable number of spectral tracks that can used.
Large-format imaging sensors (13 × 27 mm) encompass a large area of the focal plane and therefore achieve both, covering a wide spectral range and operating with a very large number of optical tracks.
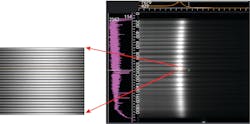
For example, a measurement system based on an IsoPlane SCT-320 spectrograph and KURO 2048 B back-illuminated sCMOS camera (Teledyne Princeton Instruments) was able to resolve 400 discrete fiber-optic channels (see Fig. 3). The large sCMOS detector not only guaranteed high sensitivity in the visible wavelength region, but can readout quickly, so data from all 400 tracks can be acquired at video rates.
Figure 3 shows the image on the detector when illuminated with fluorescent room light, with a center-region zoom highlighting the separation of the discrete fiber-optic channels. In general, all channels are well-resolved and visible with good contrast between lines.Applications of high-density multitrack spectroscopy
In the following we discuss specific application examples of multitrack spectroscopy using free space coupling and fiber coupling of light into the spectrograph.
Confocal micro-Raman spectroscopy. Confocal spectroscopy achieves high (diffraction-limited) spatial resolution and provides high suppression of any background signal outside of a small probe volume. However, it is slow when spatial information from a larger object needs to be acquired due to point-by-point scanning.
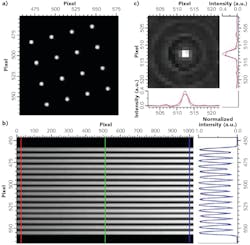
Hiro-o Hamaguchi and Sohshi Yabumoto at National Chiao Tung University (Hsinchu, Taiwan) developed a confocal technique that shows how multitrack spectroscopy potentially reduces observation time. Instead of a single laser spot, their system uses an array of multiple laser excitation spots. Using a smart arrangement of optical elements, the signal from each location is directed to a different height along the entrance slit plane. Figure 4 shows the arrangement of signal spots in the entrance slit plane as well as the spectral tracks on the sensor.The spectrograph system used consisted of an Isoplane SCT-320 spectrograph and a ProEM EMCCD camera with 1024 × 1024 pixels and a pixel size of 13 μm. A total of 16 tracks were measured, but the researchers were looking into increasing the number of tracks to 100. An order-of-magnitude improvement in acquisition time for a Raman scan was achieved by scanning a surface with all spots in parallel. The researchers emphasize the importance of the imaging quality of the spectrograph for multitrack experiments.
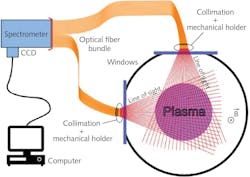
Characterizing plasmas. Noncontact optical spectroscopic methods play an important role in the characterization of plasmas. Plasma monitoring requires collecting data from various positions within the plasma. Optical fibers are commonly used for collecting the optical signal. Gonzalez-Fernandez et al. implemented a spectral tomographic technique based on collection of optical signals along multiple lines of sight into the plasma from various angles and directions (see Fig. 5). The signal was collected by 49 fibers that were arranged in a bundle along the entrance slit of an IsoPlane 160 spectrograph, with a ProEM-HS 1024 EMCCD camera for fast detection of the signal.The increase in information from the large number of spectral channels allows for the tomographic reconstruction of the location-dependent temperature and electron density within the plasma.
Multitrack spectroscopy using a single spectrograph-camera system can have important impacts on measurement efficiency, speed and information collection by detecting signal from multiple input signals in parallel. Multitrack measurements require spectrographs with high imaging power. Next generation, multipurpose spectrographs such as the Teledyne Princeton Instruments IsoPlane series can operate with dozens to hundreds of parallel inputs. Applications include fundamental research from life sciences and condensed-matter physics to plasma monitoring and astronomy, as well as industrial research, development, and quality and process control.
REFERENCES
1. S. Yabumoto and H. Hamaguchi, Anal. Chem., 89, 14, 7291–7296 (2017); https://doi.org/10.1021/acs.analchem.7b00614.
2. V. Gonzalez-Fernandez et al., Sci. Rep., 10, 5389 (2020); https://doi.org/10.1038/s41598-020-62426-9.
Sebastian Remi | Applications Scientist, Teledyne Princeton Instruments
Sebastian Remi is Applications Scientist at Teledyne Princeton Instruments, Acton, MA.


