OPTICS FOR BIOPHOTONICS: Multivariate optical elements beat bandpass filters in fluorescence analysis
RYAN J. PRIORE
Life science assays such as flow cytometry, tissue staining, polymerase chain reaction, and enzyme-linked immunosorbent assays (ELISA) use fluorescent tagging or labeling techniques with fluorochromes, dyes, or quantum dots as the mechanism for analyte detection or discrimination. Commercially available antibodies directly conjugated to highly purified fluorochromes offer a wide variety of target specificities and color options, with the success of a multiparameter fluorescent assay fundamentally dependent on the selection of fluorescent labels.
The optical subsystem for detecting the fluorescent labels is basically a filter photometer in which an excitation light source-laser or light-emitting diode (LED)—induces fluorescence of the taggant molecules at the sample. Fluorescence signals are collected by relay optics, passed through optical bandpass filters, and ultimately detected by a photodiode or photomultiplier tube.
To measure multiple parameters (colors) simultaneously, an optimization of light source and emission optical bandpass filter(s) is performed, where the bandpass filter for each target fluorochrome captures a high level of emitted photons at the primary detector for the target while minimizing the contribution of overlapping emission into the secondary or "spillover" detectors. Unfortunately, this spectral overlap presents problems when using a filter-based analysis system. An alternative fluorescence assay technique using multivariate optical elements can improve upon traditional bandpass filter implementations without the expense of full spectrometer-based analysis.
Traditional filter approach
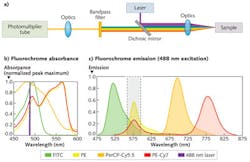
While multicolor fluorescence targets most often require a variety of light sources, a single light source can be used to illustrate the traditional filter-based detection process. Consider an argon-ion laser (λmax = 488 nm) as the light source for illuminating four different fluorochromes that all possess a relatively high absorption cross-section at 488 nm: fluorescein isothiocyanate (FITC); phycoerythrin (PE); peridinin chlorophyll-cyanine (PerCP-Cy5.5); and phycoerythrin-cyanine (PE-Cy7). To detect PE in the significant presence of spectroscopic overlapping fluorochromes like FITC and PE-Cy7, compensation (multiparameter correction based on linear algebra) is needed via hardware and software for traditional optical bandpass filters (see Fig. 1).
Compensation is achieved through the use of traceable standards. Analytical measurements are performed on the standards to assess the total impact of spectroscopic overlap. For multicolor or multiparameter flow cytometry, compensation is not always a trivial process and unfortunately leads to standard deviation differences in measured signals among the primary and spillover detectors (resulting in broader detection distributions and decreased sensitivities) as well as fluorescence detections less than zero.1-3
Full spectroscopic (or multiwavelength) detection as opposed to discrete bandpass detection can increase the specificity and sensitivity for a target fluorochrome; however, the introduction of a spectrometer is not always feasible based upon the system requirements of life science assays. An ideal spectroscopic encoding device would possess the sensitivity and specificity of a laboratory optical spectrometer with the simplicity and form factor of a filter photometer instrument configuration.
The MOE platform
Traditional multivariate calibration techniques like principle component regression (PCR) and partial least squares (PLS) extract spectral patterns related to pure component spectral variations and analyte concentrations or classifications in digitized data on a computer. A regression or loading vector may be calculated from a training set of mixture spectra to correlate analyte concentration or classification with the magnitude of a spectral pattern. Optical spectra and the associated spectral patterns can be viewed as vectors in hyperspace, where the true concentrations or classifications of an analyte are projections of the spectral vectors onto the spectral pattern vector.
Multivariate optical computing (MOC) combines the data collection and processing steps in a traditional multivariate chemical analysis into a single step and offers an all-optical computing technology. This MOC instrumentation is also inexpensive to manufacture compared to scanning instrumentation, and its compact, field-portable design lets the user resolve specific fluorochromes in complex matrices. The speed benefit due to an optical regression can offer real-time measurements with relatively high signal-to-noise ratios (SNRs) that realize the advantages of chemometrics in a simple instrument.
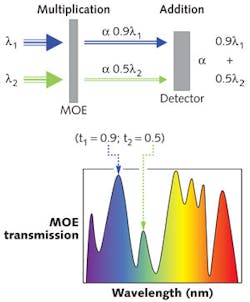
MOEs are custom, wide-bandpass thin-film interference filters that exploit the capabilities of MOC. The MOEs are encoded with one of many possible spectral patterns by using the optical transmission and reflection characteristics of the interference filter to detect/measure a complex chemical signature (target fluorochrome or class of fluorochromes) in the presence of a strongly interfering matrix (secondary fluorochromes).4,5 To apply an optical scalar product, the MOE induces a spectroscopic weighting or multiplication of the incident photons while an addition of the MOE-weighted photons occurs at the broadband detector. Simple instruments incorporating MOEs can realize the advantages of a multivariate calibration without the active use of a computer or an experienced operator for post-processing of the data (see Fig. 2).
In addition to overcoming spectral interference from other fluorochromes, MOEs can also be designed with insensitivity to pH-induced color shift of fluorochromes or other artifacts that may deteriorate a measurement and offer a utility for classes of fluorescence taggants as opposed to just one. Recently, MOEs have been used to discriminate among multiple phytoplankton species based on fluorescence excitation.6 The implementation of an MOE for a specific application can be summarized in three steps (see Fig. 3).
Step 1: Technical feasibility
The evaluation of a potential MOE application begins with an assessment of technical feasibility. If an application can be solved with an optical spectrometer, then an MOE solution is also viable. The system requirements are then defined for the application to include spectroscopic wavelength range of interest (ultraviolet, visible, or near-infrared), point detection or imaging mode of operation (angular field of view), environmental conditions of operation, and such performance metrics as sensitivity, specificity, concentration prediction error, and misclassification rate, among others.
Next, a calibration and validation spectroscopic data set is constructed and evaluated for the intended application. For the previous fluorochrome example, mixture fluorescence spectra of FITC, PE, PerCP-Cy5.5, and PE-Cy7 are generated based upon the system requirements. An assessment of the data via PLS or other chemometric routine enables a first look as to whether the performance metrics of the system requirements can be achieved.
Since an MOE instrument performs a radiometric power measurement for a defined analyte, it is paramount that the radiometric response of the intended instrument is understood. The effective spectral radiance measured by each fluorochrome detector is generated by convolving the fluorescence spectrum of the fluorochrome with the following parameters: optical element configuration (longpass filters, shortpass filters, or dichroic mirrors, for example); radiometric response of the detector(s); and optical transmission functions of the focusing/collection optics.
Step 2: MOE design
Optical computing with interference filters is an analyte-specific technique. The design of an MOE occurs through the optimization of a unique set of thin films that transmit and reflect weighted portions of the optically isolated spectral range to correlate spectral changes (peak intensities or shifting in the calibration spectra) with changes in the known analyte's physical or chemical properties.7 Designing a specific, wideband multilayer optical filter entails the sampling of a multidimensional surface, where each dimension corresponds to a layer thickness.
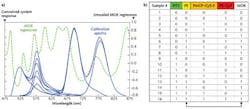
The goal of the optimization is to adjust the values in each dimension until a global minimum of the figure of merit is discovered. This iterative process will seek out any and all spectral deviations, even if one or more spectrally interfering species are present. The resulting optical regression vector is mostly orthogonal to all interfering spectral components and mostly parallel with the analyte component. An MOE for PE discrimination in the presence of spectrally interfering fluorochromes can be designed using the convolved system response calibration spectra (see Fig. 4).
Step 3: MOE fabrication
MOEs are fabricated with classic deposition equipment, techniques, and materials and tend to require fewer coating layers than traditional bandpass filters for less deposition chamber time. Optical thin-film manufacturers liken the resulting spectral profiles of MOEs to arbitrary filter designs or gain-leveling filters. Again for the fluorochrome discrimination example, dielectric materials are used for the thin-film design/fabrication process; however, there are multiple high/low-index material pairs that can be used for developing MOEs.
Through the multiplexing advantage of the MOE platform, laboratory-grade spectrometer performance can be achieved with a simple optics platform using just a light source, filter, and detector. By shifting the mathematical reliance of compensation into the optical domain, fluorochrome discrimination applications can ultimately realize an increase in sensitivity and specificity as compared to bandpass filter detection alone.
REFERENCES
1. M. Roederer, Cytometry, 45, 3, 194–205 (2001).
2. H. T. Maecker et al., Cytometry Part A, 62A, 2, 169–173 (2004).
3. L. A. Herzenberg et al., Nat. Immunol., 7, 7, 681–685 (2006).
4. M. P. Nelson et al., Anal. Chem., 70, 1, 73–82 (1998).
5. M. L. Myrick et al., Vib. Spectrosc., 28, 73–81 (2002).
6. L. S. Bruckman et al., Appl. Spectrosc., 66, 1, 60–65 (2012).
7. O. O. Soyemi et al., Appl. Spectrosc., 56, 4, 477–487 (2002).
Ryan J. Priore is chief technology officer of Cirtemo, 618 Naples Ave., Cayce, SC, 29033; email: [email protected]; www.cirtemo.com.


